KDbg
A Graphical Debugger Interface
KDbg
A Graphical Debugger Interface
KDbg is a graphical user interface to gdb, the GNU debugger. It provides an intuitive interface for setting breakpoints, inspecting variables, and stepping through code.
KDbg requires KDE, the K Desktop Environment, but you can of course debug any program.
Inspection of variable values in a tree structure.
Direct member: For certain compound data types the most important member values are displayed next to the variable name, so that it is not necessary to expand the subtree of that variable in order to see the member value. For example, you don't need to go into a variable of type QString if you want to see the string that the variable holds. (BTW, this is of course not hardcoded, but can be extended to new types.) KDbg can even display Qt's QString values, which are Unicode strings.
Debugger at your finger tips: The basic debugger functions (step, next, run, finish, until, set/clear/enable/disable breakpoint) are bound to function keys F5 through F10. Quick and easy.
Of course, lots of other basic functions: View source code, search text, set program arguments and environment variables, display arbitrary expressions. Everything you need to debug a program!
Debugging of core dumps, attaching to running processes is possible.
Conditional breakpoints.
If you are missing your favorite feature, see the todo-list whether I plan to add it. Drop me a note if you can't find it!
KDbg is authored by Johannes Sixt.
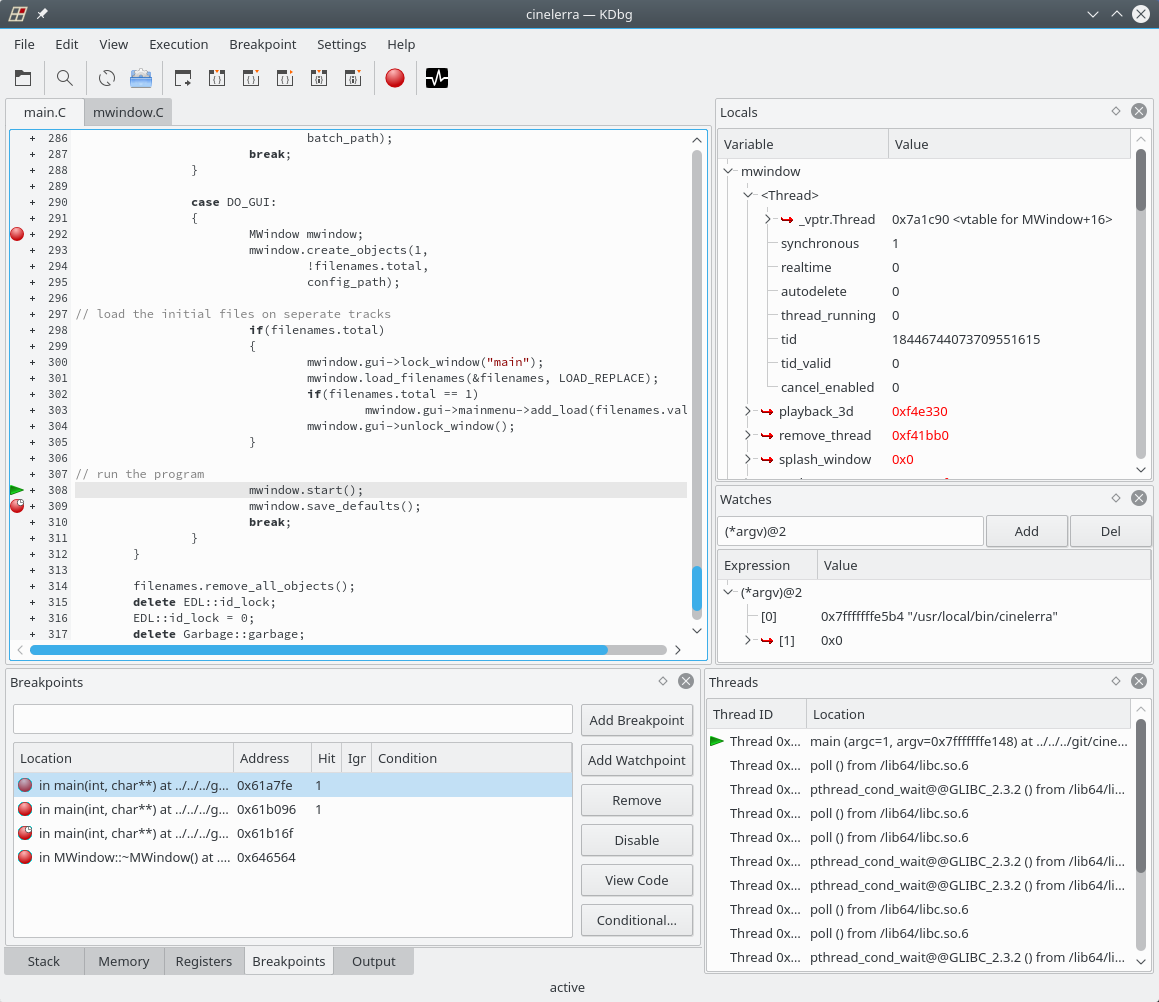
The largest subwindow of the this screenshot is the source code. Below the breakpoint list is visible. The right column shows local variables, watched expressions, and the thread list (from top to bottom).
To the left of the lines of source code the breakpoints as well as the current point of execution are indicated. You see different kinds of breakpoints: normal, disabled, temporary.
Clicking the small '+' signs in front of the source code lines will display the machine code of the source line.
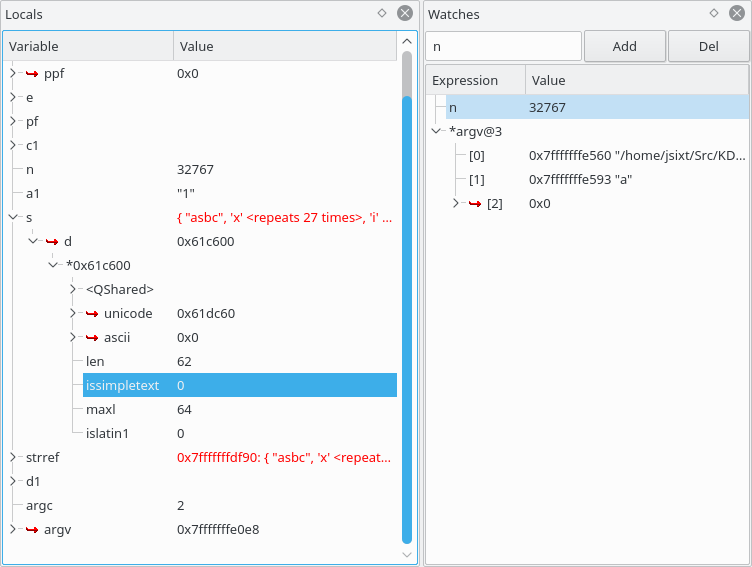
This screen shot shows the local variables (of the current stack frame) and arbitrary watch expressions side by side. Notice that the contents of certain class members are displayed next to the variable, in this case of type QString, although the variable is not expanded. Variables that have changed since the last stop are indicated in red color.
Click here to download the source code of KDbg 3.1.0 - stable version (from SourceForge.net).
Consider joining the KDbg mailing list.
KDbg development uses git. To clone the git repository, do this, which you need to do only once:
git clone -b maint https://github.com/j6t/kdbg.git
This will create a new directory kdbg in your current directory that contains the entire development history. It will follow the stable branch of KDbg. If you already have done this in the past, you can download the latest stable version with this command:
git pull origin maint
You can also browse the project history.
Compiling is straight forward. Extract the source archive, then go to the newly created directory and type:
cmake .
make
sudo make install
It is necessary that you have the KDE header files and libraries installed. Some distributions do not automatically install the header files. Please make sure that you installed them. It may also be necessary to explicitly tell the location of KDE, e.g.:
cmake -DCMAKE_INSTALL_PREFIX=/usr .
Official Debian packages are available from https://packages.debian.org/kdbg. (Special thanks go to Ana Guerrero!)
A new development cycle is maintained in the GIT repository, in the branch master. To download it, you need git. To clone this branch of the git repository, do this, which you need to do only once:
git clone https://github.com/j6t/kdbg.git
This will automatically set up your working directory to follow the development branch master. If you already have done this in the past, you can download the development version with this command:
git pull
Contributions are, of course, always welcome. If you have a favorite patch, just send it to me (see footer for email address). But if you have a more voluminous change that you want to have included, you better use git. Please fork the repository at Github and file a pull request.
Release notes for version 3.1.0.
Release notes for version 3.0.1.
Release notes for version 3.0.0.
Release notes for version 2.9.1.
Release notes for version 2.9.0.
Release notes for version 2.5.6.
Release notes for version 2.5.5.
Release notes for version 2.5.4.
Release notes for version 2.5.3.
Release notes for version 2.5.2.
Release notes for version 2.5.1.
Release notes for version 2.5.0.
For more tips see the online documentation.
You can use gdb's format specifiers for displaying values in the expression watch window in different formats. Just prefix the expression to display by the format specifier. Example: /x foo->bar will display the value of foo->bar in hexadecimal notation. Here is a list of gdb's format specifiers:
| /x | hexadecimal | /f | float |
| /o | octal | /a | address |
| /d | decimal | /i | instruction |
| /u | unsigned decimal | /c | char |
| /t | binary | /s | string |
The problem with dynamically loaded modules is that the debugger doesn't know about the symbol information until the module has been loaded by dlopen(). This is extremely annoying if you want to debug constructors that are run for static variables. The following trick works on systems that use glibc2.
Note that the orphaned breakpoints feature does not really help. The reason is that orphaned breakpoints are not tried to be installed until the program stops. For this reason it is still required to set the breakpoint in _dl_debug_state. However, the breakpoints are preserved and can be set at any time, even before the program starts.
There's a hack so you can do remote debugging. Invoke kdbg like this:
kdbg -r /dev/ttya proggy
Then KDbg issues the following gdb commands, in effect, it allows you to debug a remote target:target remote /dev/ttya
file proggy
As you see, you could also do remote debugging through TCP/IP connection like this:
kdbg -r flaky:12345 proggy
assuming host flaky is running gdbserver with proggy on port 12345.
Note that you can set a program specific gdb command using the Settings|This Program menu.
The following is a list of things that I intend to build in some day. They are roughly sorted most important first. You can influence the order by dropping me a note or by building it in yourself and sending me the patch :-). There is also a TODO file in the source code which lists many more items.
The following is a list of things that are not very likely ever to find their way into KDbg.
Last modified December 3, 2023